
How Growing Companies Can Use Maps to Find Underserved Areas
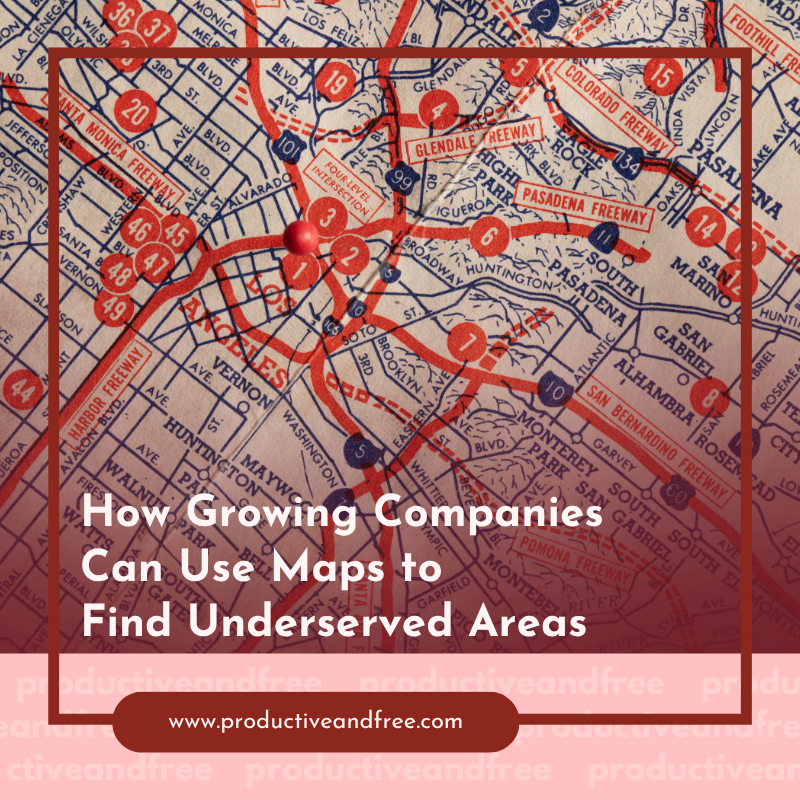
Expansion planning almost always begins with a list of the largest metros, which is precisely why the largest metros are the most contested places a company can open. The counties where a new entrant faces no direct rival are rarely the ones on that list, and they are usually the ones nobody has bothered to map. In 2025, 4% of census tracts in the United States qualified as banking deserts and another 4% as potential deserts, which left about 23.5 million people with limited access to a branch. Comparable holes exist in pharmacy coverage, child care, veterinary care and specialty retail.
Underserved Markets and the Density Instinct
Density is easy to defend. A metro with two million residents obviously contains more buyers than a county with 40,000, and the forecast built on that population comes out larger. The cost of entering the dense market rarely gets the same attention. Rent is higher, wages are higher, the incumbents have been there for a decade, and the marketing spend required to take a point of share from them is a permanent line item.
A gap market inverts those economics. The company arrives with no established competitor to outspend, and the residents who currently drive 30 minutes for the service are already demonstrating demand. Acquisition cost falls because the alternative to the new business is a long drive. That is a weaker moat over five years, since a second entrant can follow, but the first two years belong to whoever gets there.
Public Data Sources for Coverage Gaps
The inputs for gap analysis are free and public, which is the part most companies overlook. Census tract population and income come from the American Community Survey. Provider counts come from state licensing boards, which publish the address of every licensed pharmacy, veterinarian, dentist, day care and contractor in the state. Business registration filings give a rough count of active firms by category and county.
The analysis is a division problem. Take the count of providers in a geography and divide it by the population that geography holds. The result is a coverage ratio, and the outliers on that ratio are the candidate markets. Child care research uses a version of this, defining a shortage as any area with more than three children under six for every licensed slot. By that measure, 46% of young children in the United States live in a shortage area.
Ratios alone produce false positives. A county with one pharmacy for 15,000 residents looks underserved until the map shows that the pharmacy is a regional chain store on the highway that everyone already uses. Coverage has to be checked against geography before it means anything.
The reverse error is quieter and more expensive. A county with four providers reads as well served until the map puts all four in the same town, leaving the other 60% of the population an hour from any of them. Averages conceal both failures, and only the plotted version shows which one is present.
Distance and the Definition of a Gap
Every gap definition depends on a distance threshold, and the threshold changes the answer. Pharmacy research generally treats 10 miles as the rural cutoff and one mile as the urban one. Grocery access studies use different numbers again. The threshold has to match how the company's own customers travel, because a 20 minute drive is routine in one county and disqualifying in another.
Several thresholds tested together settle the question. free mapping software will redraw the same catchment at three miles, at ten and at a 25 minute drive, and the markets that survive every version are the ones worth field work. Gaps that appear only at the widest threshold are usually artifacts of the threshold.

Early Signals From Supply Loss
Many underserved areas form when supply leaves. Watching where providers are closing points to gaps six to twelve months before anyone publishes a report about them.
Retail banking is the cleanest example. The number of branches nationwide fell 5.6% between 2019 and 2023, and more than 300 net branches closed in 2025 alone, with bank branches disappearing fastest in places that already had few of them. Retail pharmacy has moved the same direction, with roughly 7,000 closures since 2019 and announced plans from Walgreens to shut 1,200 stores and from CVS to shut 900. The result is the growth of pharmacy deserts in both low income urban neighborhoods and rural counties, where residents now travel considerable distances to fill a prescription.
Child care follows a similar pattern with a different cause. Reporting on how child care demand outpaces supply has documented rural areas where the licensed supply is close to zero, and roughly 60% of rural families with young children have no access to a licensed provider at all. A closure announcement in any of these categories is a dated, addressed, public signal that a market has an opening in it.
Retail Entry Into Thin Markets
Dollar General built a national footprint on this logic. Most of its stores are in towns under 20,000 residents, several miles from the nearest supermarket or big box competitor. While chains such as Macy's and Gap were shedding expensive square footage, Dollar General was opening almost 20 stores a week in exactly the places those chains had never entered. Customers in those markets may drive 20 miles to a Walmart and 5 miles to a Dollar General, and the company has treated that difference as the entire proposition.
The expansion into fresh produce came from the same reading. Stores in rural food deserts stock produce that the nearest full grocer is too far away to supply conveniently, which turns a distance problem into a category decision. Around 1,500 additional stores were slated to carry produce, a range decision driven by the absence of competition in those specific towns.
How to Rank Candidate Markets
A gap map produces more candidates than any company can act on, which makes the ranking step the one that decides the outcome. Score each candidate on the population inside the threshold, the median income of that population, the driving distance to the nearest existing provider and the cost of operating there. Weight the scores according to what the business actually needs, since a service with high fixed costs cares about population first while a discretionary retailer cares about income first.
Then check the reason for the gap. Some markets are empty because nobody has tried. Others are empty because someone tried and failed, or because a licensing rule, a lease restriction or a labor shortage makes operation impractical. The second category looks identical to the first on a coverage map and behaves nothing like it after opening. A week of phone calls to former operators separates them.
From Gap Map to Opening Plan
Build the coverage ratio, set a distance threshold that matches how customers travel, subtract the markets that are empty for a reason, and the shortlist is short enough to visit in a single trip. About 48.4 million people, one in seven Americans, live at least 10 miles from a pharmacy, and pharmacy deserts are present in 46% of counties in the country. The same exercise runs on any category a company sells into.




























Share in the comments below: Questions go here

Maximize your Canva lead magnets to generate daily traffic. Explore effective techniques to attract more visitors and enhance your online presence!